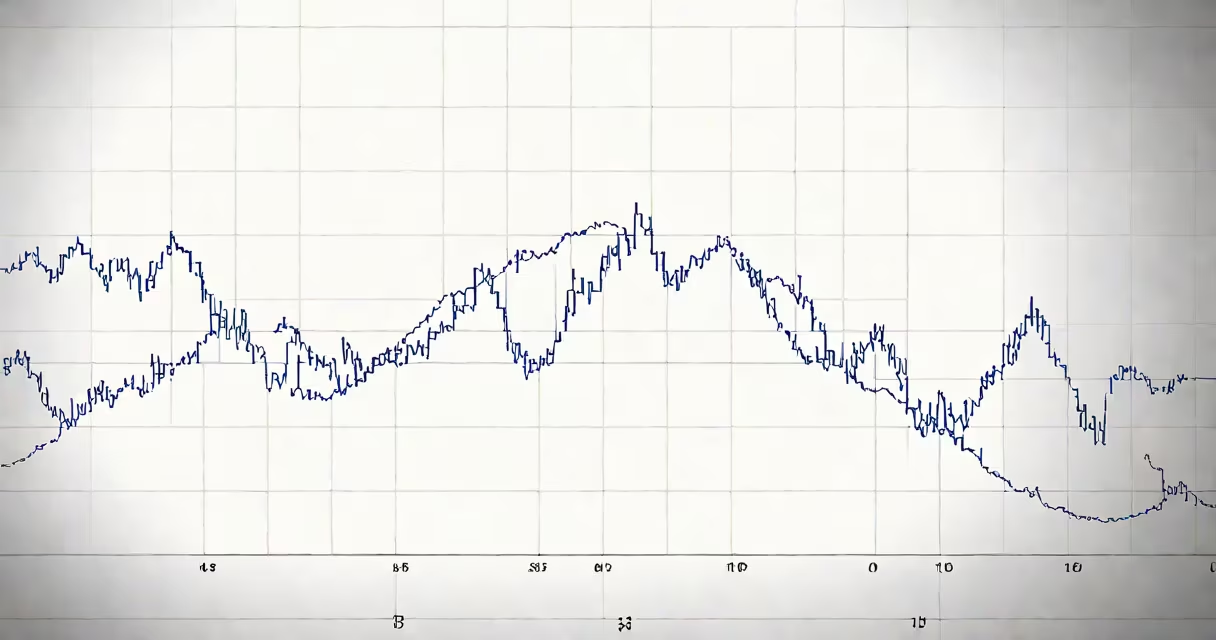
The range of a graph is the set of all output values (y-values) that the function produces across its domain. It defines the vertical span of the plotted curve or line.
For any graph drawn on a coordinate plane, the range is determined by observing the highest and lowest points along the vertical axis. If the graph extends infinitely upward or downward, the range may include all real numbers or be bounded by specific limits.
A function's range is not always visible at a glance. It requires analyzing the behavior of the equation or tracing the path of the plotted points. For example, a parabola opening upward has a minimum value but no upper bound, so its range starts at that minimum and extends to infinity.
On a Cartesian grid, the horizontal axis (x-axis) represents inputs (domain), and the vertical axis (y-axis) shows outputs (range). When reading a graph, the range corresponds to the vertical extent of the curve.
To find the range, locate the lowest and highest y-values the graph reaches. If the graph touches or crosses a particular y-value, that value belongs to the range. If the graph approaches a value but never reaches it-like a horizontal asymptote-it may not be included.
For continuous graphs, such as those of polynomial or trigonometric functions, the range is often expressed as an interval. For instance, a graph that spans from y = -3 to y = 5 includes all values between those endpoints, written as [-3, 5].
Different functions produce different range behaviors. Here's how common types differ:
| Function Type | Range Example | Reason |
|---|---|---|
| Linear (e.g., y = 2x + 1) | (−∞, ∞) | Extends infinitely in both directions vertically. |
| Quadratic (e.g., y = x²) | [0, ∞) | Minimum at y = 0; no negative values. |
| Sine Wave (e.g., y = sin(x)) | [−1, 1] | Peaks at 1, troughs at −1; never exceeds these bounds. |
Trigonometric functions like sine and cosine have predictable ranges due to their periodic nature. The standard sine function, y = sin(x), oscillates between −1 and 1 indefinitely. Its range is always [−1, 1], regardless of how many periods are shown.
Non-periodic functions can have more complex ranges. A rational function like y = 1/x has a range of (−∞, 0) ∪ (0, ∞), excluding zero because division by zero is undefined. This exclusion creates a gap in the range.
Many learners confuse range with domain. The domain refers to valid x-values, while the range is about y-values. On a graph, domain is read left-to-right; range is read bottom-to-top.
Another frequent error is assuming that all graphs cover every y-value between min and max. That's only true for continuous functions. Discontinuous graphs-such as step functions or piecewise-defined equations-may skip certain y-values even within the vertical span.
Here's a non-obvious point: the range of a graph depends on the viewing window. A calculator or software display may clip parts of a graph, making the visible range appear narrower than the actual mathematical range. Always verify with the underlying equation.
Consider the graph of y = sin(x). This function repeats every 2π units and reaches a maximum of 1 and a minimum of −1. These extremes occur at regular intervals: sin(π/2) = 1 and sin(3π/2) = −1.
Even if you only see one period-from 0 to 2π-the graph shows the peak at (π/2, 1) and the valley at (3π/2, −1). Since the function smoothly connects these points and never goes above 1 or below −1, the range is exactly [−1, 1].
This result holds true no matter how many cycles are displayed. The sine wave never exceeds ±1. You can verify this using known identities: |sin(x)| ≤ 1 for all real x, as confirmed by the Wolfram MathWorld entry on sine.
When working with transformed sine graphs-like y = 2sin(x) or y = sin(x) + 3-the range shifts accordingly. For y = 2sin(x), the amplitude doubles, so the range becomes [−2, 2]. For y = sin(x) + 3, the entire graph shifts up by 3 units, resulting in a range of [2, 4].
Understanding the range of a graph is essential in fields like physics, engineering, and economics. In signal processing, for example, the amplitude of a wave corresponds to its maximum deviation from zero-directly tied to the range.
In a real-world scenario, measuring temperature changes over time results in a graph where the range reflects the highest and lowest temperatures recorded. If a weather station logs daily highs between 60°F and 85°F, the range of the temperature graph is [60, 85] in degrees Fahrenheit.
I once analyzed a dataset of hourly electricity demand over a week. The graph showed peaks near 120 megawatts and lows around 80 megawatts. After confirming the data points, I concluded the range was [80, 120] MW. This helped determine whether the power grid needed reinforcement during high-demand periods.
The range of a graph is not just a theoretical concept-it's a practical tool for interpreting data, predicting behavior, and solving problems across disciplines.