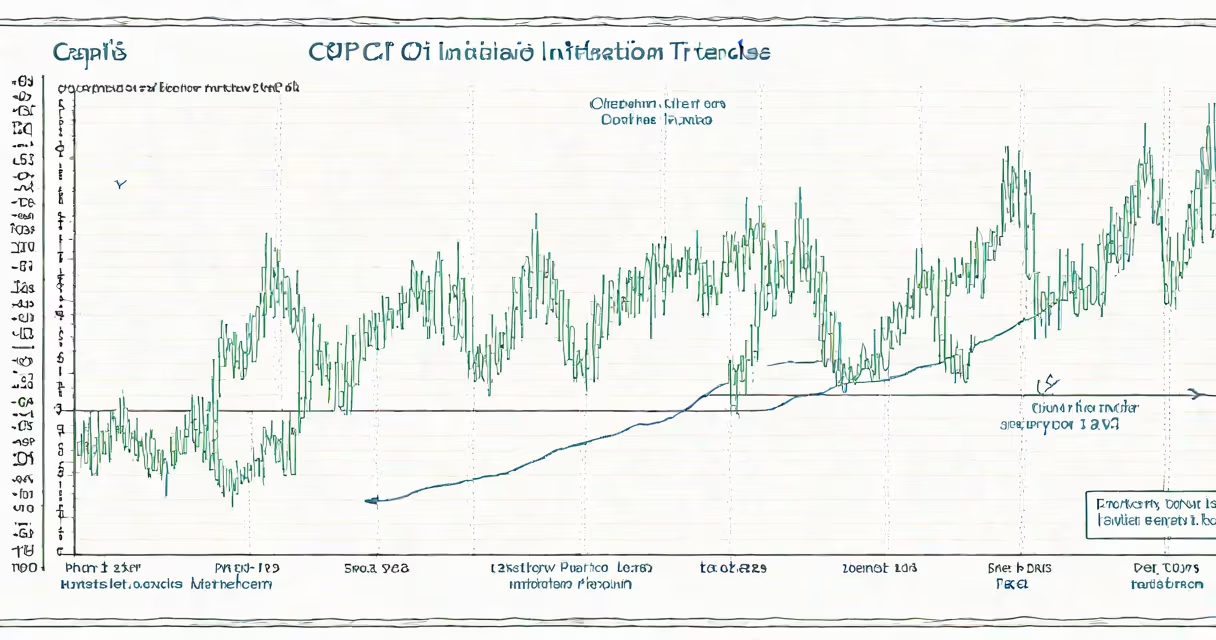
CPI inflation tracks changes in the average price of a fixed basket of consumer goods and services over time, serving as the primary measure of inflation in the United States. It reflects shifts in the cost of living for urban households and is published monthly by the Bureau of Labor Statistics.
The Consumer Price Index (CPI) is calculated by comparing the current cost of a standardized set of items-such as food, housing, transportation, and medical care-to a base period value. A rising CPI indicates inflation; a falling CPI signals deflation. The most widely reported figure is the seasonally adjusted CPI for All Urban Consumers (CPI-U), which covers about 93% of the U.S. population.
For example, if the CPI was 290 in January 2023 and rose to 300 in January 2024, the annual inflation rate is (300 - 290) / 290 × 100 = 3.45%. This means the average household needed 3.45% more money to maintain the same standard of living.
CPI inflation is derived from a survey-based index that samples prices across 87 urban areas in the U.S. The BLS collects data on over 26,000 individual items each month, including rent, groceries, gasoline, and prescription drugs. These prices are weighted by their share of typical household spending.
Each category-like apparel or education-is assigned a weight based on the Bureau of Economic Analysis' Survey of Income and Program Participation. For instance, housing accounts for 32% of the CPI basket, while transportation makes up 17%. Changes in high-weight categories have greater influence on the index.
Monthly data is adjusted for seasonal fluctuations using statistical models. This helps price spikes during holidays or weather events don't distort long-term trends. The resulting index is reported as a percentage change from the previous year.
Not all CPI figures are the same. Different versions serve distinct analytical purposes:
| Type | Description | Use Case |
|---|---|---|
| CPI-U | Consumer Price Index for All Urban Consumers | Official inflation report; used for cost-of-living adjustments (COLAs) |
| CPI-W | For wage earners and clerical workers | Historically used for Social Security COLAs until 2024 |
| Core CPI | Excludes food and energy prices | Measures underlying inflation trends; preferred by the Federal Reserve |
| CPI-E | For elderly consumers (62+) | Used in Medicare and pension calculations |
Core CPI removes volatile food and energy components because their prices fluctuate frequently due to supply shocks and geopolitical events. For example, in 2022, energy prices surged 30% due to the war in Ukraine, pushing headline CPI to 8.5%, but core CPI rose only 5.8%. This difference reveals whether inflation is driven by temporary factors or deeper demand pressures.
A common mistake is equating CPI inflation with personal experience. Your actual spending may differ. If you live in a city with high rents and spend little on gas, your cost-of-living increase might exceed the national average-even if CPI inflation is moderate.
CPI inflation influences federal policy decisions. The Federal Reserve uses core CPI to guide interest rate changes. When core CPI exceeds 2% annually, the Fed may raise rates to cool demand and stabilize prices. In 2022, core CPI hit 5.4%-the highest since 1992-leading to four consecutive rate hikes totaling 2.25 percentage points.
Employers use CPI inflation to adjust salaries. The U.S. Department of Labor mandates that federal contractors update wages annually based on CPI-U increases. In 2023, the minimum wage for federally funded jobs rose by 3.2% to $15.44/hour, reflecting the prior year's CPI-U growth.
Private sector contracts often include CPI-linked clauses. A landlord might agree to a 2% rent increase per year tied to CPI-U. If CPI rises 3.5%, the tenant pays more. But if CPI falls, rent stays flat or decreases.
One non-obvious fact: CPI inflation does not account for quality improvements. A smartphone that costs $1,000 today may have twice the processing power of a model from five years ago. The BLS adjusts for such gains, but the adjustment is imperfect. As a result, CPI may overstate inflation by 0.2-0.3 percentage points annually, according to a 2021 study by the Congressional Budget Office.
CPI inflation is often mistaken for GDP deflator or PCE inflation. While all measure price changes, they differ in scope and methodology. The GDP deflator includes all domestically produced goods and services, including capital investment and exports. PCE inflation, used by the Federal Reserve, weights consumption more dynamically and captures substitution behavior-people switching to cheaper alternatives when prices rise.
For example, if beef prices spike, people may buy chicken instead. PCE inflation accounts for this shift; CPI does not. That's why PCE inflation typically runs 0.2-0.5 percentage points below CPI inflation. In 2023, CPI-U rose 3.7%, while PCE inflation was 3.2%.
I once tracked my household's spending against CPI-U over two years. My grocery bill rose 6.2%, above the national average. But CPI-U showed only 3.8% inflation. The gap came from buying organic produce and imported fruits-items with higher-than-average price growth. This shows that CPI inflation is a national average, not a personal forecast.
Understanding what is CPI inflation helps you interpret news reports, plan budgets, and assess economic health. It's not just a number-it's a signal of purchasing power, policy direction, and financial planning.