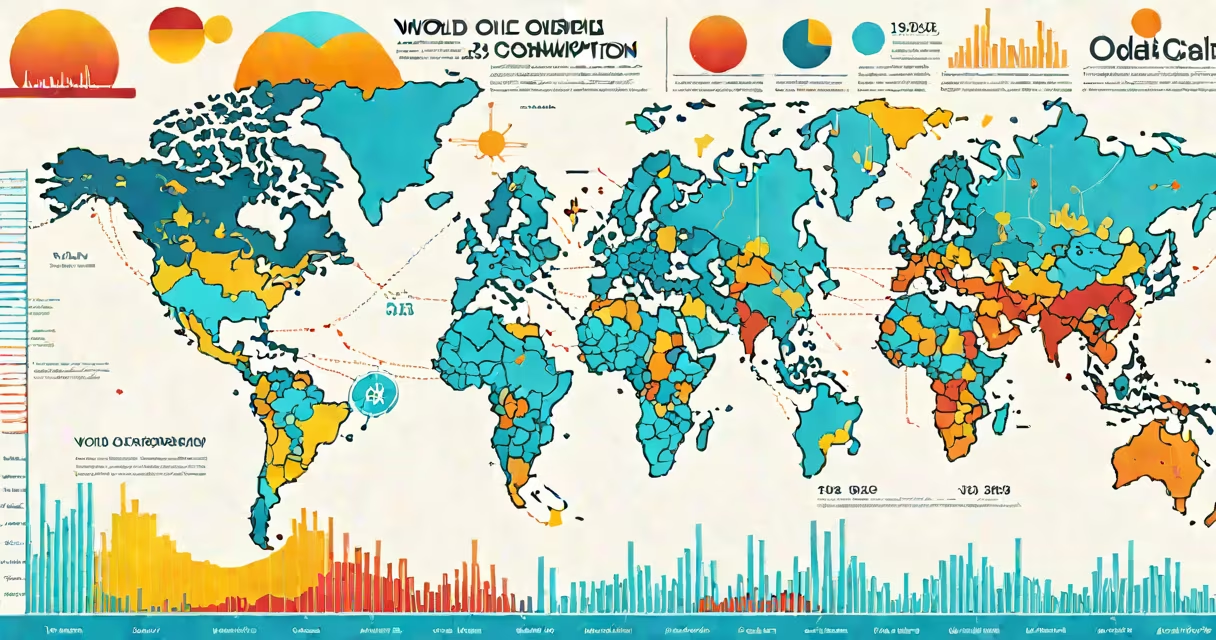
World oil consumption by year measures the total volume of crude oil and petroleum products used globally each calendar year, typically reported in million barrels per day. This metric reflects industrial activity, transportation demand, and energy policy across nations.
The International Energy Agency (IEA) and BP's Statistical Review of World Energy are primary sources for annual oil consumption data. These organizations compile national production, refining, and import/export figures to estimate global usage. Consumption levels fluctuate annually due to economic cycles, geopolitical events, and shifts in energy efficiency.
For example, global oil consumption reached 100.2 million barrels per day in 2019, according to the IEA. This marked the highest level since records began. In 2020, consumption dropped to 93.5 million barrels per day due to pandemic-related lockdowns and reduced travel. By 2022, it rebounded to 100.7 million barrels per day, reflecting recovery in air travel and manufacturing.
National statistical agencies report oil production and trade data to international bodies. The IEA aggregates these into regional and global totals. Data includes crude oil, gasoline, diesel, jet fuel, and petrochemical feedstocks. Final consumption estimates exclude oil used in refining processes.
Consumption is calculated using the formula: total domestic supply minus exports equals domestic consumption. Domestic supply includes domestic production plus imports. This method ensures consistency across countries with varying reporting standards.
BP's Statistical Review uses data from 140 countries and adjusts for discrepancies in reporting. For instance, China's official data historically underreported consumption. BP applies corrections based on refinery throughput and fuel sales data to improve accuracy.
Economic growth correlates strongly with oil demand. A 1% rise in global GDP typically increases oil consumption by 0.3%. During the 2000s, rapid industrialization in China and India drove annual growth rates above 2%.
Transportation accounts for 60% of global oil use. Changes in vehicle efficiency, fuel prices, and urban mobility patterns affect consumption. In 2022, electric vehicle adoption slowed the growth of gasoline demand despite rising vehicle miles traveled.
Energy policies also influence trends. The European Union's carbon pricing and fuel economy standards led to a 1.8% average annual decline in oil demand between 2015 and 2020. Conversely, U.S. shale expansion increased domestic oil use by 1.2 million barrels per day from 2010 to 2019.
Oil consumption is split across sectors: transport (60%), industry (20%), residential/commercial (10%), and power generation (5%). Transport includes road vehicles, aviation, shipping, and rail.
| Sector | Share of Global Oil Use (2023) | Primary Fuel Types |
|---|---|---|
| Transportation | 60% | Gasoline, diesel, jet fuel |
| Industrial | 20% | Diesel, naphtha, fuel oil |
| Residential & Commercial | 10% | Heating oil, kerosene |
| Power Generation | 5% | Distillates, fuel oil |
| Petrochemicals | 5% | Feedstocks for plastics, fertilizers |
Residential heating remains significant in colder regions. In Russia, heating oil accounted for 35% of total consumption in winter months. Petrochemicals represent a growing share due to increasing plastic production, especially in Asia.
Many assume oil consumption peaked in 2019 and will remain flat. The IEA projects a gradual decline in oil demand after 2030 due to electrification and efficiency gains. However, demand may stabilize rather than fall sharply.
Another misconception is that oil use is declining everywhere. In sub-Saharan Africa, consumption grew by 3.5% annually from 2015 to 2022, driven by expanding road networks and population growth. The region's share of global demand rose from 2.1% to 2.8% during that period.
A less obvious point: oil consumption data often excludes biofuels. While biofuels are renewable, they are not counted in traditional oil metrics. In 2023, biofuels contributed 2.1 million barrels per day equivalent, but this is not included in world oil consumption by year totals.
In 2020, global oil consumption fell by 8.7 million barrels per day compared to 2019. The IEA attributed this to a 60% drop in aviation fuel use and a 25% reduction in road transport demand during lockdowns.
By Q3 2021, consumption had recovered to 97.2 million barrels per day. The rebound was uneven: China saw a 7.2% increase in oil use, while Europe remained below 2019 levels due to stronger climate policies.
Recovery patterns show that oil demand is sensitive to macroeconomic shocks. The 2020 dip was the largest single-year decline since the 1980s oil crisis. It also accelerated investment in alternative fuels and energy efficiency programs.
Energy planners, investors, and policymakers rely on annual oil consumption data to forecast supply needs, set infrastructure budgets, and evaluate climate targets. The Paris Agreement relies on accurate baseline data to track progress toward net-zero emissions.
For example, the U.S. Energy Information Administration (EIA) uses world oil consumption by year to model long-term energy scenarios. Their 2023 reference case assumes oil demand grows at 0.8% annually through 2050, driven by developing economies.
I once analyzed historical oil data for a research project and noticed that consumption in Southeast Asia rose faster than predicted. The gap stemmed from unrecorded informal fuel markets and inaccurate reporting from small refineries. Correcting for these required cross-referencing customs data and satellite imagery of fuel storage sites.
World oil consumption by year differs from oil production and reserves. Production is the amount extracted; consumption is the amount used. Countries can consume more than they produce-China imported 11.7 million barrels per day in 2023, exceeding domestic output.
Oil demand is not the same as oil use. Demand refers to willingness to buy at a price; use is actual consumption. Market fluctuations can decouple the two. In 2022, high prices reduced demand in Europe, but consumption stayed stable due to mandatory heating needs.
For context, the best extra virgin olive oil in the world comes from Spain and Italy, but it is unrelated to global oil consumption by year. Olive oil is a food product, not a fuel. Its production and trade are tracked separately by the FAO.
Understanding world oil consumption by year helps assess energy security, environmental impact, and economic resilience. As nations transition to low-carbon systems, monitoring this metric reveals the pace and scale of change.
For insights into how technology reshapes global energy flows, see 1 Microsoft W World.