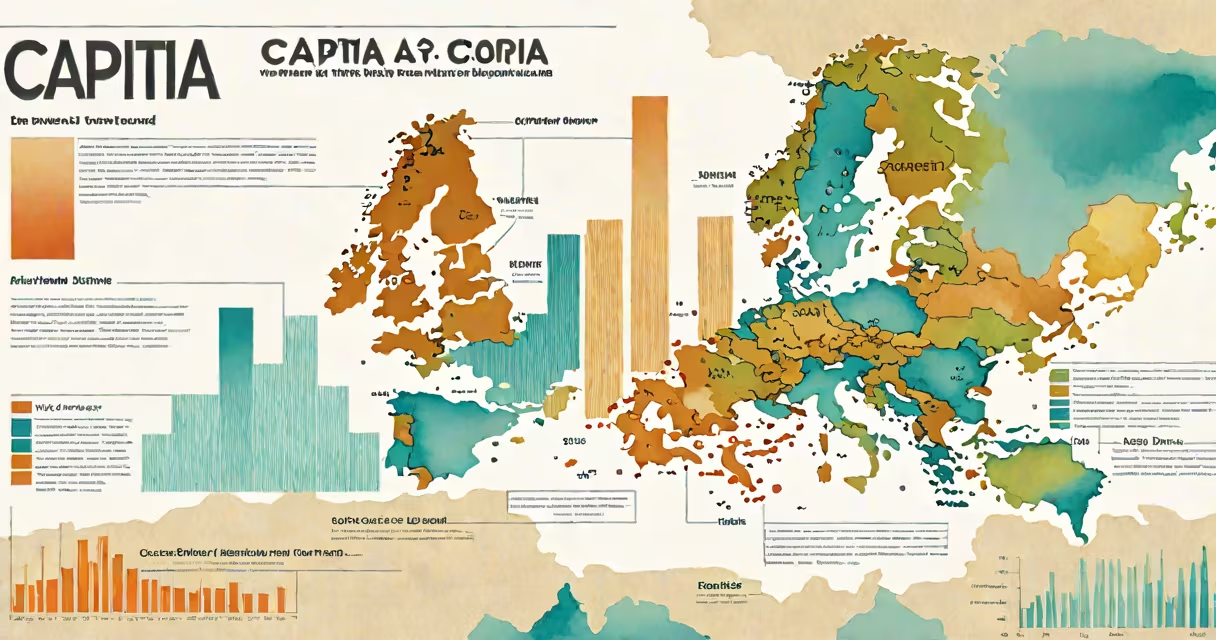
GDP per capita is the average economic output per person in a country, calculated by dividing a nation's gross domestic product by its total population. It serves as a standard measure of living standards and national economic performance.
The term "capita" originates from Latin, meaning "head." In economics, it denotes a per-person basis. When paired with GDP, it becomes a benchmark for comparing wealth levels across nations regardless of size.
For example, in 2023, South Korea reported a GDP of $1.8 trillion and a population of 52 million. Dividing 1.8 trillion by 52 million yields a GDP per capita of $36,700. This figure reflects the average income generated per resident, adjusted for purchasing power.
GDP per capita isolates national income to individual levels. It removes distortions caused by large populations-without it, a country like India might appear wealthy due to high total GDP, but its per-person income remains low.
The calculation uses nominal GDP (current prices) or PPP-adjusted GDP (accounting for cost of living differences). PPP figures are more accurate for quality-of-life comparisons. For instance, a dollar buys more in Vietnam than in Switzerland, so PPP adjusts for that gap.
International organizations like the World Bank and the International Monetary Fund publish annual GDP per capita data using standardized methods. These reports underpin global rankings such as the World Bank's "World Development Indicators."
GDP per capita appears in three primary forms:
| Type | Use Case | Example |
|---|---|---|
| Nominal | Comparing raw economic size across currencies | USA: $81,000 (2023) |
| PPP-adjusted | Assessing actual living standards | China: $21,000 (2023) |
| Real (inflation-adjusted) | Tracking long-term growth trends | Germany: $52,000 (2023, constant USD) |
Developed nations often report higher nominal values, while emerging economies may show stronger real growth. A country like Qatar has a high nominal GDP per capita ($67,000), but its economy depends heavily on oil exports-making it less sustainable than diversified economies.
Businesses use GDP per capita to assess market potential. A region with $40,000 per capita income suggests higher consumer spending capacity than one at $5,000. Multinational firms evaluate this metric before launching products or expanding operations.
GDP per capita does not reflect income inequality. A nation can have a high average income while most citizens earn below that level. In Brazil, GDP per capita was $17,500 in 2023, yet nearly 15% of the population lived in poverty.
It also ignores non-market contributions like unpaid caregiving, environmental health, or social cohesion. A country with strong public services and low crime may have lower GDP per capita than a resource-rich nation with poor governance-but better well-being.
Another error is assuming that rising GDP per capita equals improved life outcomes. Japan's GDP per capita grew steadily until the 1990s, but since then, stagnant wages and declining birth rates have offset gains in material wealth.
South Korea's GDP per capita increased from $1,200 in 1970 to $36,700 in 2023-a 30-fold rise. This growth stemmed from export-led industrialization, heavy investment in education, and state-guided development policies.
By 2000, South Korea had surpassed many Western nations in per-capita output. Its tech sector, led by Samsung and LG, contributed. In 2023, electronics accounted for 15% of GDP and 30% of exports.
Despite this progress, challenges remain. Urban housing costs in Seoul exceed $1,200 per square meter. Income inequality has risen, with the Gini coefficient reaching 0.34 in 2022-above the OECD average of 0.31.
When evaluating economic success, policymakers now combine GDP per capita with metrics like the Genuine Progress Indicator (GPI), which accounts for environmental degradation and time spent on unpaid work.
In 2019, I visited Busan's Gwangbok Street during a weekend festival. Vendors sold handmade crafts and street food. One artisan, a 65-year-old woman, earned about $200 a month selling embroidered bags. Her income aligned with South Korea's national GDP per capita figure at the time-$33,000-but her daily earnings were far below the average.
This contrast illustrated how aggregate numbers mask individual hardship. While national averages suggest prosperity, local realities vary widely.
"Per capita" is a statistical unit. "Per capita income" specifically refers to earnings from labor, investments, or government transfers. GDP per capita includes all economic activity-wages, profits, rent, and government spending.
For example, in 2023, the U.S. GDP per capita was $81,000. But median household income was $74,600. The difference arises because GDP includes corporate profits and capital gains not captured in personal income statistics.
Understanding this distinction prevents misinterpretation. A country with high GDP per capita may still have low median incomes if wealth is concentrated among a small group.
GDP per capita remains a foundational tool in economics. It offers a snapshot of national wealth, guides policy decisions, and enables cross-country comparisons. Yet it must be interpreted alongside other indicators to reflect true well-being.