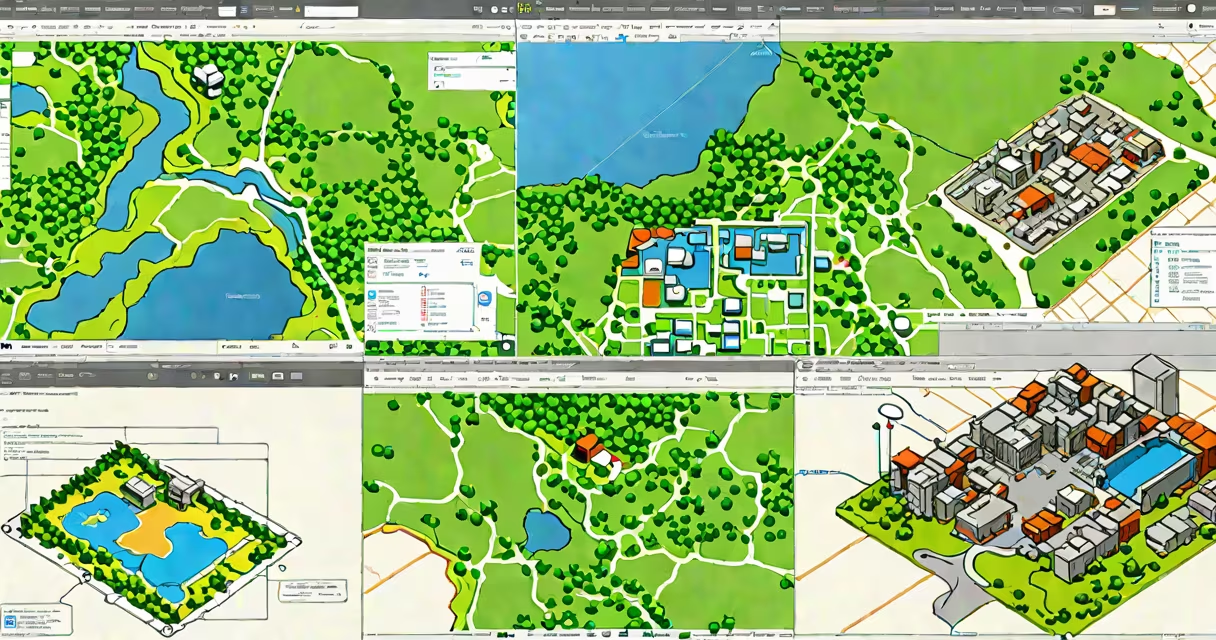
GIS software examples are specialized programs that capture, store, analyze, and display geographic data. These tools enable users to visualize spatial relationships, perform location-based analysis, and support decision-making across fields like urban planning, emergency response, and environmental monitoring.
At its core, GIS software interprets coordinates-latitude and longitude-and overlays them with attributes such as population density, land use, or elevation. This allows users to identify patterns, simulate scenarios, and generate actionable insights. For example, during a wildfire, emergency managers use GIS software to model fire spread based on wind direction, vegetation type, and terrain slope.
Major platforms like Esri's ArcGIS and the open-source QGIS offer advanced tools for spatial modeling, network analysis, and 3D visualization. Other tools such as GRASS GIS and gvSIG serve niche academic and government applications. All function by integrating vector data (points, lines, polygons), raster data (satellite imagery, elevation models), and attribute tables into interactive maps.
GIS software operates through a layered architecture. Each layer represents a different type of geographic feature-roads, rivers, census tracts, or weather fronts. Layers are combined using spatial queries, such as "find all schools within 1 km of a flood zone." The software calculates intersections, distances, and overlaps using coordinate reference systems (CRS) to ensure accurate positioning.
When a user adds a dataset, the software checks its CRS. If it doesn't match the project's CRS, the system reprojects the data on the fly. This helps measurements like area or distance remain accurate. For example, a city planner measuring the size of a park in square meters must use a projected coordinate system-not latitude/longitude-to avoid distortion near the poles.
Analysis functions include buffer creation (e.g., draw a 500-meter buffer around a factory to assess pollution impact), overlay operations (combine soil type and rainfall data to predict erosion risk), and heat mapping (visualize crime incidents over time). These capabilities are accessible via graphical interfaces or scripting languages like Python, which integrate with libraries such as GeoPandas and GDAL.
The following table outlines major GIS software by category, use case, and licensing model.
| Software | Type | Licensing | Primary Use Cases |
|---|---|---|---|
| ArcGIS Pro | Commercial desktop | Proprietary (subscription) | Urban planning, infrastructure management, military intelligence |
| QGIS | Open-source desktop | Free (GPLv3) | Environmental research, humanitarian mapping, education |
| Google Earth Engine | Cloud-based platform | Free for research; paid for enterprise | Global land cover change, deforestation tracking, climate modeling |
| GRASS GIS | Open-source command-line & GUI | Free (GNU GPL) | Hydrological modeling, terrain analysis, ecological research |
| Mapbox Studio | Web-based design tool | Freemium (paid tiers) | Custom web maps, mobile app integration, real-time traffic visualization |
Each tool excels in specific domains. ArcGIS Pro dominates in government and corporate environments due to its integration with enterprise databases and secure authentication. QGIS thrives in academic settings because it supports plugin development and runs on low-spec hardware. Google Earth Engine enables large-scale analysis of satellite imagery-processing petabytes of Landsat and Sentinel data in minutes.
One lesser-known fact: many GIS software packages do not render maps in real time. Instead, they cache tiles or use WebGL rendering engines to display complex datasets efficiently. This explains why zooming into high-resolution aerial imagery sometimes takes a few seconds-even on fast computers.
Urban planners use GIS software to evaluate zoning proposals. A city council reviewing a new housing development might overlay proposed building footprints against existing drainage networks to prevent flooding. In one documented case, the city of Portland used ArcGIS to model stormwater runoff and reduce sewer overflow events by 37% over five years.
Public health agencies rely on GIS for disease surveillance. During the 2014 Ebola outbreak, WHO teams mapped cases in West Africa using QGIS to track transmission chains and allocate medical resources. The software helped identify hotspots and prioritize interventions in remote villages with limited internet access.
Logistics companies use GIS to improve delivery routes. UPS leverages proprietary GIS algorithms to reduce fuel consumption and improve on-time delivery rates. Their system evaluates thousands of route combinations daily, factoring in traffic patterns, road closures, and delivery windows-all processed in under 10 seconds per route.
Many assume that all mapping tools are GIS software. This is incorrect. A basic map viewer like Google Maps lacks analytical capabilities. It shows locations but cannot calculate proximity, perform spatial joins, or model terrain flow. True GIS software includes logic for spatial relationships-such as "contains," "intersects," or "within"-and supports complex queries.
Another misconception is that GIS software requires expensive hardware. While large datasets demand processing power, lightweight versions run on laptops and even tablets. QGIS, for instance, operates smoothly on a 2016 MacBook Air with 8GB RAM and a 256GB SSD. The software uses efficient data formats like GeoPackage and SQLite to minimize memory usage.
I once tested QGIS on a Raspberry Pi 4 with 4GB RAM to create a county-level flood risk map using free OpenStreetMap data and NOAA elevation models. The process took under 15 minutes and produced a publishable map. This demonstrates that useful spatial analysis isn't limited to high-end workstations.
GIS software differs from general computer software in purpose and structure. While both handle data, GIS software understands geometry and spatial context. A spreadsheet program can list addresses and ZIP codes-but only GIS software can determine whether a hospital lies within a designated disaster zone.
Cloud-based GIS tools like Google Earth Engine represent a shift toward scalable, collaborative analysis. Unlike traditional desktop software, these platforms allow multiple users to access and modify projects simultaneously. Data is stored in distributed systems, enabling real-time updates across global teams.
Understanding gis software examples begins with recognizing their role in turning raw coordinates into meaningful insight. Whether analyzing urban growth, tracking wildlife migration, or responding to natural disasters, these tools change geography into action.