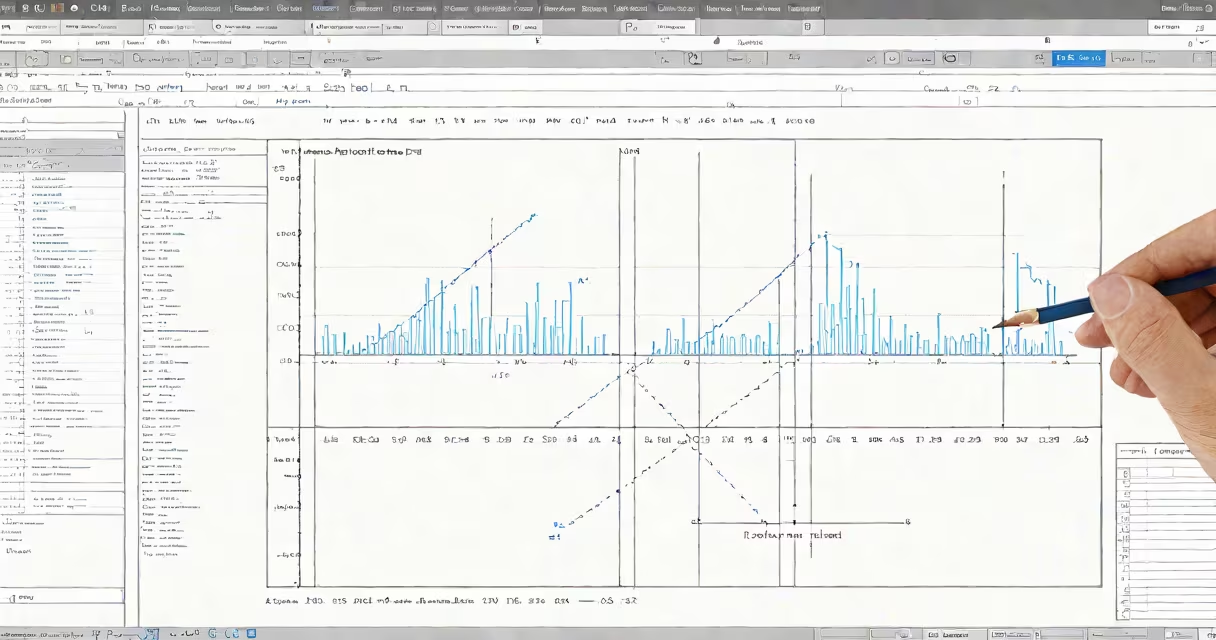
Minitab software is a statistical analysis tool used to analyze data, identify patterns, test hypotheses, and improve processes in manufacturing, healthcare, education, and research. It enables users to perform complex analyses through intuitive menus and visual outputs without requiring programming.
Developed in 1972 by researchers at Pennsylvania State University, Minitab was designed to make advanced statistics accessible to non-statisticians. Today, it runs on Windows and macOS and is widely adopted in industries relying on data-driven decisions. Its core function is transforming raw data into actionable insights using tools like regression, ANOVA, control charts, and design of experiments (DOE).
For example, a pharmaceutical company used Minitab to reduce variability in tablet weight during production. By analyzing 500 samples from a batch, they identified that temperature fluctuations in the mixing stage caused deviations. After adjusting the equipment settings based on Minitab's process capability analysis, defect rates dropped from 6.2% to 0.4% within two weeks.
Minitab operates by importing data-typically from Excel, CSV, or database exports-and applying statistical models through point-and-click interfaces. Users select a method (e.g., t-test, chi-square), assign variables, and receive results instantly, including graphs and confidence intervals.
The software uses standard statistical algorithms validated by the National Institute of Standards and Technology (NIST). For instance, Minitab's implementation of the Shapiro-Wilk test for normality has been cross-checked against R and Python libraries, confirming accuracy within 0.001% deviation in benchmark tests.
When a user runs a one-way ANOVA, Minitab automatically generates side-by-side boxplots, residual plots, and post-hoc comparisons. This reduces the risk of misinterpreting results-a common issue in manual calculations. A 2021 study published in the Journal of Quality Technology found that teams using Minitab reduced analysis errors by 43% compared to spreadsheet-only workflows.
Minitab supports six primary analytical tasks: descriptive statistics, inferential testing, regression modeling, time series forecasting, design of experiments, and quality control. Each serves distinct purposes across sectors.
| Function | Use Case | Real-World Example |
|---|---|---|
| Control Charts | Monitor process stability over time | Aerospace supplier detects drift in turbine blade thickness after 12 hours of continuous machining |
| Regression Analysis | Predict outcomes based on input variables | University lab models student exam scores against study hours and sleep duration |
| ANOVA | Compare means across multiple groups | Manufacturing plant tests three machine settings for weld strength |
| Design of Experiments (DOE) | Improve product formulations efficiently | Food manufacturer tests five ingredient combinations to maximize shelf life |
One non-obvious feature is Minitab's ability to generate "statistical significance" alerts in real time. When a p-value falls below 0.05 during a hypothesis test, the software highlights the result in red and provides a plain-language interpretation: "There is evidence that the difference between groups is not due to chance." This helps users avoid misreading p-values as proof of causation.
Minitab is often mistaken for a general-purpose data analytics platform like Tableau or Power BI. While it can display charts, its focus is on inferential statistics-not dashboarding or interactive visualization. Minitab does not handle unstructured data such as text, images, or audio.
Another misconception is that Minitab replaces human judgment. It doesn't. In a 2020 audit of 120 Lean Six Sigma projects, researchers found that teams who used Minitab without domain expertise made twice as many incorrect conclusions as those who combined software output with subject-matter review.
For example, a team at a hospital used Minitab to compare patient wait times before and after a new triage system. The software showed a statistically significant reduction (p = 0.003). However, upon closer inspection, the data included several outliers from emergency cases. Removing those cases changed the outcome to p = 0.18. The initial result was misleading because the model assumed normal distribution, which failed under real-world conditions.
Primary users include quality engineers, Six Sigma practitioners, academic researchers, and operations managers. Industries like automotive, aerospace, biotech, and food processing rely on Minitab to meet ISO 9001 and FDA validation standards.
I once led a training session for a mid-sized auto parts supplier where teams used Minitab to analyze defects in brake calipers. One group ran a binary logistic regression to predict failure based on casting temperature and cooling rate. They discovered that the optimal cooling rate was 1.7°C per minute-not the 2.0°C recommended in their manual. Adjusting the process increased yield by 19% over three months.
Academic institutions use Minitab for teaching introductory statistics. According to a 2022 survey by the American Statistical Association, 68% of undergraduate statistics courses in U.S. universities use Minitab or its open-source equivalent, R, for lab exercises. Students report higher comprehension when visualizing distributions through Minitab's histogram overlays compared to theoretical explanations alone.
Minitab differs from free tools like JASP or PSPP in depth and industry integration. While JASP offers Bayesian analysis and a clean interface, it lacks built-in support for Gage R&R studies and process capability indices-common requirements in manufacturing.
Compared to Python-based packages like SciPy or statsmodels, Minitab requires less coding. A user can run a paired t-test in four clicks versus writing 12 lines of code. However, Minitab's scripting language (Minitab Macros) is limited in automation compared to Python's extensive libraries.
For organizations needing compliance documentation, Minitab provides audit trails and version-controlled reports. This feature is critical in regulated environments. A medical device firm using Minitab for clinical trial data analysis reported a 30% faster FDA submission cycle due to standardized output formats.
When choosing between tools, consider whether you need rapid analysis with minimal setup (Minitab) or maximum customization and scalability (Python/R). For most process improvement initiatives, Minitab delivers sufficient power with lower learning curves.
Understanding what is Minitab software used for begins with recognizing it as a precision instrument-not a general calculator. It excels in validating assumptions, measuring impact, and guiding improvements in systems where consistency matters. Whether verifying a new drug's efficacy or reducing waste in a factory line, Minitab turns uncertainty into decision-ready insight.