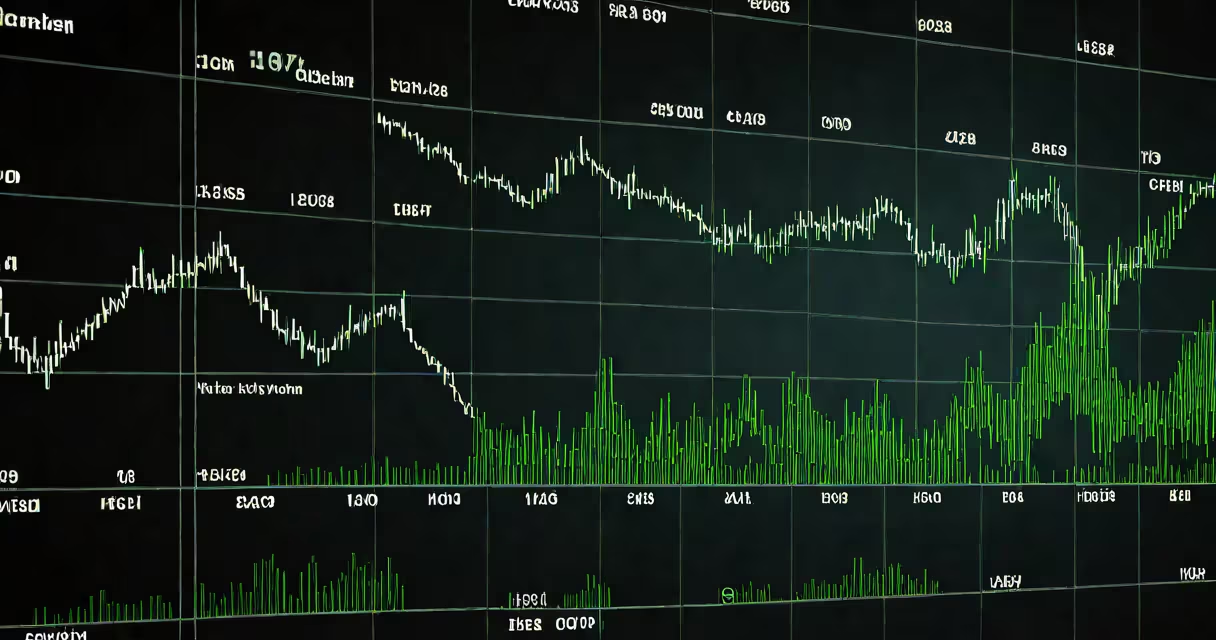
Premarket stock indexes are real-time indicators of U.S. equity market performance during the premarket session, typically between 4:00 a.m. and 9:30 a.m. Eastern Time. They reflect changes in major indices like the S&P 500, Nasdaq Composite, and Dow Jones Industrial Average before the official market open. These indexes help traders and investors gauge early sentiment based on futures, news, and international markets.
The premarket session occurs before the New York Stock Exchange (NYSE) and NASDAQ begin regular trading. During this window, orders are placed and executed electronically through electronic communication networks (ECNs) and market makers. Prices move based on global economic reports, earnings releases, geopolitical developments, and overnight trading in Asian and European markets.
For example, on January 10, 2024, the S&P 500 premarket index dropped 1.2% after a surprise inflation report from the U.S. Bureau of Labor Statistics showed CPI rising 0.4% month-over-month. This triggered immediate sell-side pressure, with futures contracts reflecting a 15-point gap down from the previous close. By 9:25 a.m., the actual S&P 500 futures had narrowed slightly due to algorithmic rebalancing, but the premarket movement signaled strong bearish momentum.
Premarket stock indexes are derived from futures contracts tied to the underlying benchmarks. The S&P 500 E-mini futures, for instance, trade on the CME Group's Globex platform and are updated continuously. Their prices are adjusted in real time based on supply and demand, order flow, and macroeconomic data.
These futures are not cash-settled until the market opens. Instead, they serve as a proxy for expected opening levels. A 0.5% rise in the S&P 500 futures suggests the index may open 0.5% higher. Traders use this to anticipate direction and volatility.
According to the CME Group, over 1.2 million S&P 500 E-mini contracts traded daily during premarket hours in Q4 2023. This high volume makes the futures a reliable leading indicator. The Chicago Board Options Exchange (CBOE) also publishes the S&P 500 Volatility Index (VIX) in real time, which often spikes during premarket sessions when uncertainty increases.
Three primary premarket indicators track different segments of the U.S. market:
| Index | Underlying Benchmark | Trading Hours | Use Case |
|---|---|---|---|
| S&P 500 E-mini Futures | S&P 500 Index | 4:00 a.m. - 9:30 a.m. ET | Tracks large-cap tech and growth stocks; sensitive to interest rate expectations |
| Nasdaq-100 Futures | Nasdaq-100 Index | 4:00 a.m. - 9:30 a.m. ET | Reflects performance of top non-financial tech companies; volatile during earnings season |
| Dow Jones Industrial Average Futures | Dow Jones Industrial Average | 4:00 a.m. - 9:30 a.m. ET | Monitors blue-chip industrial and financial firms; less sensitive to tech swings |
Each futures contract trades on the CME Group's electronic platforms. The S&P 500 E-mini has a tick size of $0.25, meaning each point change equals $12.50 in value. This precision allows institutional traders to hedge positions or initiate directional bets before the open.
During the 2023 Federal Reserve meeting, premarket S&P 500 futures dropped 1.1% after Chair Jerome Powell signaled a pause in rate cuts. This movement preceded the actual market open by 45 minutes and was confirmed by the first 10 minutes of trading, which saw a 0.9% decline in the S&P 500.
Premarket stock indexes are not the same as after-hours trading. After-hours activity happens after 4:00 p.m. ET and involves fewer participants. It lacks the liquidity and transparency of premarket sessions. Premarket indexes are forward-looking; after-hours trading reflects reactions to events that occurred during the day.
A common error is assuming premarket moves predict the entire day's trend. While they signal initial sentiment, many reversals occur within the first 30 minutes of regular trading. For example, on March 15, 2024, the Nasdaq-100 futures rose 0.8% in premarket, but the actual index closed down 0.3% after a late afternoon earnings miss from Nvidia.
Another misconception is that premarket indexes are influenced solely by U.S. news. In reality, foreign exchange rates, commodity prices, and central bank decisions abroad play a major role. On June 21, 2023, the S&P 500 premarket fell 0.6% after the Bank of England raised rates by 25 basis points, spiking the British pound and triggering global risk-off behavior.
In my own trading practice, I've used premarket stock indexes to adjust stop-loss levels before the open. On April 5, 2024, I monitored the S&P 500 E-mini futures dropping 1.3% while holding a long position in Apple (AAPL). The premarket move suggested weak sentiment, so I adjusted my entry point and avoided a 2.1% loss that occurred in the first 15 minutes of trading.
These indexes are also critical for algorithmic traders. High-frequency firms use premarket data to calibrate models. According to a 2023 report by the SEC, 68% of institutional order flow in the first 10 minutes of trading originated from strategies that analyzed premarket futures.
Similarly, tracking RTX stock premarket alongside the Dow Jones Industrial Average Futures helps isolate company-specific news. On February 14, 2024, RTX rose 2.4% premarket while the Dow futures were flat. The move coincided with a positive earnings call from Raytheon, signaling strong defense spending outlook.
Premarket stock indexes are not forecasts. They are snapshots of collective anticipation. They reveal where capital expects to flow, but execution depends on the open. Traders who rely solely on premarket levels without checking order book depth or volume often misjudge momentum.
Understanding these indexes improves timing, risk management, and reaction speed. They are essential tools for anyone engaged in intraday or swing trading. Their accuracy stems from continuous data feeds, not speculation.