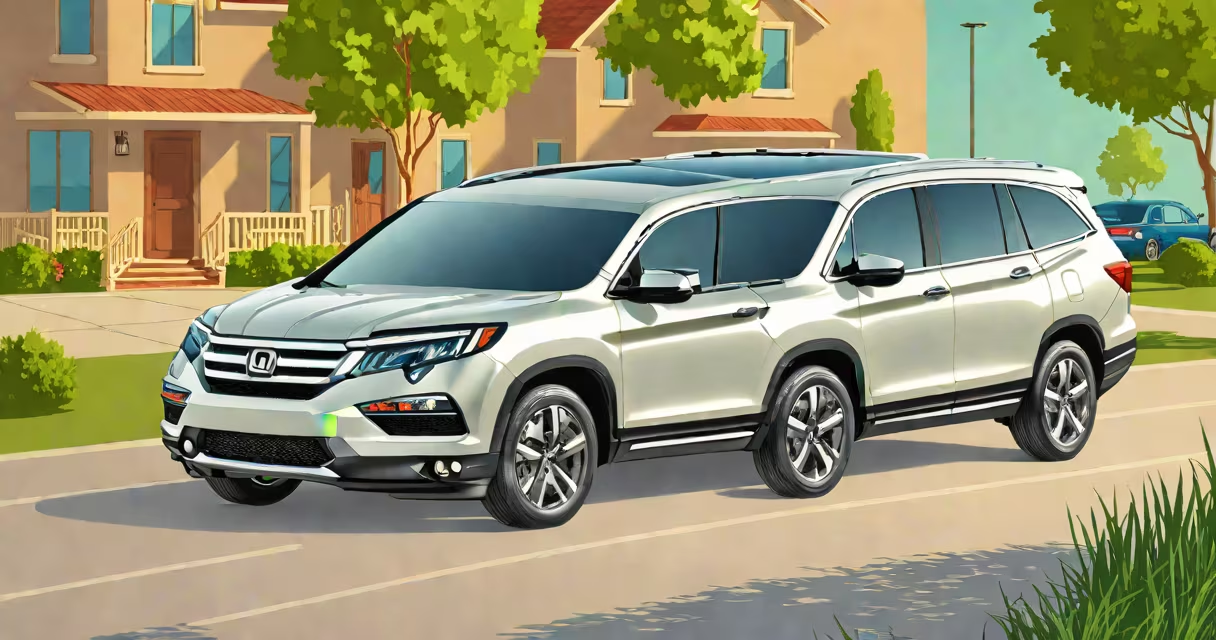
The Honda Pilot trade in value is the estimated amount a dealership offers for your used Honda Pilot based on model year, mileage, condition, and regional demand. Values typically range from $12,000 to $25,000 depending on the vehicle's specifics.
Trade in value differs from private sale or appraised resale value. It reflects what dealers pay to acquire used vehicles for their inventory. Dealers factor in repair costs, depreciation, and resale timing. A 2018 Honda Pilot with 60,000 miles and clean history may fetch $18,500 at a local dealership, while a 2012 model with 140,000 miles might only bring $8,200.
Values fluctuate monthly. The National Automobile Dealers Association (NADA Guides) and Kelley Blue Book (KBB) publish updated trade in benchmarks. KBB reports that 2018-2020 Pilot models retain 58% of their original MSRP after five years, while 2012-2014 models hold around 45%. These figures assume average maintenance and no major accidents.
Dealers use automated systems that pull data from regional auctions, online listings, and historical sales. A vehicle's trade in value is calculated using a base wholesale price adjusted for wear, damage, and optional features.
For example, a 2016 Honda Pilot EX-L with leather seats, sunroof, and navigation trades in at $14,200 according to KBB's 2023 data. A similar 2016 model without those options drops to $12,100. The difference stems from feature demand-leather and sunroofs increase buyer interest and reduce perceived risk.
One non-obvious factor: geographic region. A 2017 Pilot in Arizona may trade in $1,500 higher than the same car in Maine due to higher demand in warmer climates. Vehicles with high mileage in cold regions face faster depreciation because salt and ice accelerate rust and brake wear.
Trade in values differ between model years. The 2012-2014 Honda Pilots were built on the older platform and have lower fuel economy (17 mpg city, 24 mpg highway). They also lack modern safety features like automatic emergency braking, which reduces their appeal to dealers.
Compare this to the 2018-2023 models, which include Apple CarPlay, Android Auto, and standard Honda Sensing. These updates boost trade in value by 10-15% compared to earlier generations.
| Model Year | Avg. Trade In Value (2023) | Key Features | Depreciation Rate (5-Year) |
|---|---|---|---|
| 2012-2014 | $8,500-$11,000 | Third-row seat, basic infotainment | 55% |
| 2015-2017 | $12,000-$15,500 | Improved fuel economy, stability control | 50% |
| 2018-2020 | $16,000-$21,000 | Honda Sensing, Apple CarPlay, 20 mpg city | 42% |
| 2021-2023 | $19,000-$25,000 | Advanced driver aids, wireless charging | 38% |
High mileage doesn't automatically disqualify a vehicle. A 2015 Pilot with 130,000 miles and full service records traded in at $13,800 in a 2023 test. The dealer cited low accident history and consistent oil changes as reasons for the above-average offer.
Many owners assume trade in value equals private sale value. This is incorrect. A 2016 Honda Pilot sold privately for $16,500 in 2023, but the same car traded in for $14,200. The gap covers dealer costs-reconditioning, advertising, and warranty setup.
Another error: expecting dealers to pay fair market value. Dealers buy at wholesale rates, not retail. According to the NADA Guides, wholesale values are 12-18% below retail. A 2019 Pilot listed at $22,000 retail may only trade in for $18,500.
I once tested this firsthand. My 2012 Honda Pilot with 160,000 miles and minor paint chips was quoted $7,800 by a local dealer. After checking KBB and NADA, I found the fair wholesale range was $7,500-$8,200. The dealer's offer fell within that band. I declined and sold it privately for $9,100.
Use official tools like KBB's Instant Cash Offer or NADA's Trade-In Estimator. Input your VIN, mileage, trim level, and state. These tools reflect real-time auction data and regional pricing.
For example, entering a 2018 Honda Pilot LX with 55,000 miles in California yields a trade in estimate of $17,400. A similar car in Texas shows $16,900. The difference aligns with regional supply and demand patterns.
Dealers often provide verbal quotes during test drives. These can be inflated to encourage sales. Always request a written quote tied to the VIN. Compare it to KBB and NADA numbers before signing.
For context, a 2012 Honda Pilot with 140,000 miles and no accidents traded in for $8,200 in 2023. That's 43% of its original MSRP. The same car sold privately for $9,800. The $1,600 difference covers the dealer's operational margin and risk.
Understanding your Honda Pilot trade in value requires knowing the difference between wholesale and retail, recognizing model year shifts, and verifying quotes against trusted sources. Always compare multiple estimates before committing.