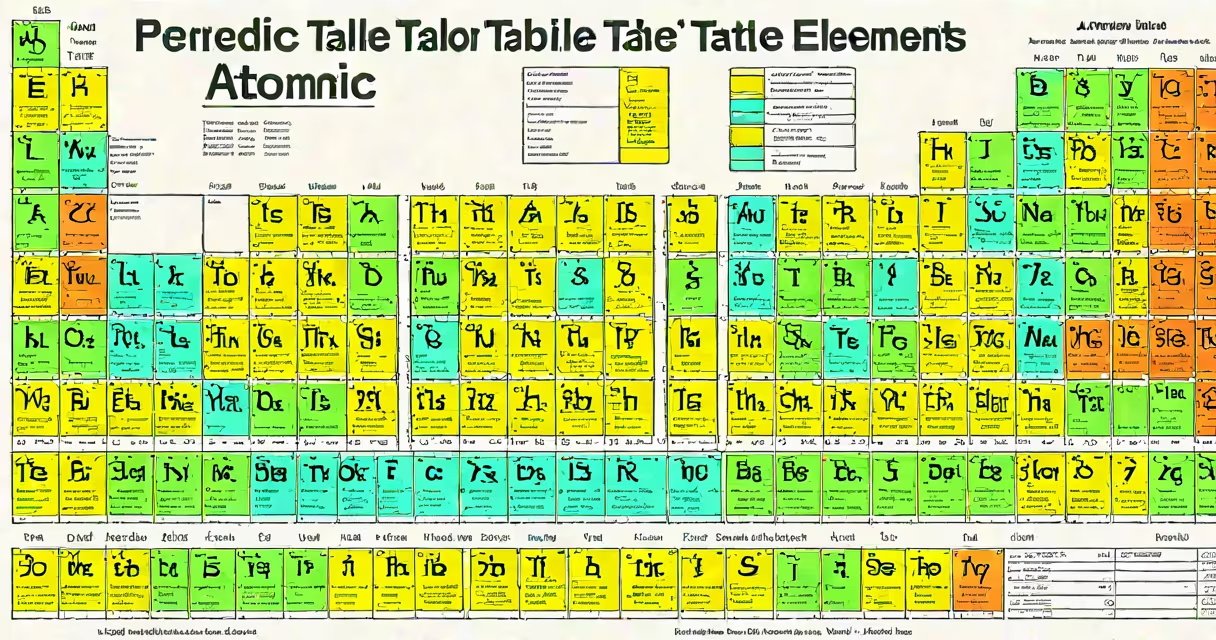
The periodic table of elements with atomic mass number lists all known chemical elements arranged by increasing atomic number, with each element's average atomic mass displayed in the upper right corner of its cell. This version integrates both elemental identity and mass information, enabling quick comparison of isotopic abundance and material density across groups.
Elements are ordered left to right and top to bottom based on their atomic number-the count of protons in the nucleus. As atomic number increases, so does the number of electrons and neutrons, which collectively determine atomic mass. The atomic mass number listed is a weighted average of naturally occurring isotopes, reflecting real-world sample composition rather than a single isotope's mass.
For example, carbon has an atomic number of 6 and an average atomic mass of 12.011 atomic mass units (u). This value reflects the presence of carbon-12 (98.9%) and carbon-13 (1.1%), with negligible carbon-14 in nature. The number 12.011 appears in the element's cell on standard periodic tables, not 12 or 13.
The periodic table of elements with atomic mass number functions as a predictive tool. Elements in the same group (vertical column) share similar electron configurations and chemical behavior due to matching valence electrons. For instance, Group 1 (alkali metals) includes lithium (Li), sodium (Na), and potassium (K)-all highly reactive with water and forming +1 ions.
Atomic mass increases across periods (horizontal rows) due to added protons and neutrons. However, the increase is not uniform. Iron (Fe, atomic number 26) has an atomic mass of 55.845 u, while cobalt (Co, atomic number 27) has 58.933 u-higher despite being adjacent. This irregularity arises because atomic mass depends on isotope distribution, not just proton count.
Mass number differences between neighboring elements reveal nuclear stability patterns. Elements with even atomic numbers often have more stable isotopes. Tin (Sn, atomic number 50) has ten stable isotopes-the most of any element-while neighboring indium (In, 49) has only one stable isotope. This trend supports the shell model of nuclear structure.
The periodic table divides into four main blocks based on electron subshell filling:
| Block | Electron Subshell | Elements | Average Atomic Mass Range (u) |
|---|---|---|---|
| s-block | ns¹⁻² | Lithium to Barium | 6.94 - 137.33 |
| p-block | np¹⁻⁶ | Boron to Radon | 10.81 - 222.02 |
| d-block | (n−1)d¹⁻¹⁰ | Scandium to Mercury | 40.08 - 200.59 |
| f-block | (n−2)f¹⁻¹⁴ | Actinium to Lawrencium | 227.03 - 262.11 |
Each block shows distinct mass trends. s-block elements tend to have low atomic masses (e.g., hydrogen = 1.008 u), while f-block actinides include heavy, unstable isotopes like uranium-238 (238.05 u).
Non-metals in the p-block, such as oxygen (15.999 u) and chlorine (35.45 u), show higher mass variability due to multiple stable isotopes. Oxygen has three naturally occurring isotopes: O-16 (99.76%), O-17 (0.04%), and O-18 (0.20%), resulting in an average mass of 15.999 u.
Many assume atomic mass number equals the mass of the most common isotope. This is incorrect. For example, copper (Cu) has an atomic mass of 63.546 u, yet its two stable isotopes are Cu-63 (69.17%) and Cu-65 (30.83%). The average is not 63 or 65-it's 63.546.
Another error is treating atomic mass as constant across samples. In reality, isotopic ratios vary slightly by location. Oxygen in Antarctic ice has lower O-18 content than ocean water, affecting measured atomic mass. This variation enables climate reconstruction through isotope analysis.
Some confuse atomic mass with atomic weight. While often used interchangeably, atomic mass refers to a specific isotope's mass (e.g., carbon-12 = exactly 12 u), whereas atomic mass number on the periodic table is a weighted average across all natural isotopes.
Medical imaging uses fluorine-18, a radioactive isotope of fluorine (atomic number 9, atomic mass 18.000 u). Though fluorine's average atomic mass is 19.00 u, F-18 is produced artificially for PET scans. Its decay emits positrons detected by scanners, revealing metabolic activity in tissues.
In geology, zircon crystals preserve uranium and lead isotopes. Uranium-238 decays to lead-206 over time. By measuring the ratio of U-238 (mass 238.05 u) to Pb-206 (205.97 u), scientists estimate rock formation ages. A zircon sample with 90% U-238 and 10% Pb-206 suggests ~4.5 billion years of decay-matching Earth's oldest minerals.
I encountered this in a lab setting: analyzing a meteorite fragment revealed elevated iron-56 (55.935 u) relative to lighter isotopes. The mass difference indicated extraterrestrial origin, as terrestrial iron typically shows more mixing with Fe-54 and Fe-57.
Historical context adds depth. The original periodic table by Dmitri Mendeleev (1869) predicted undiscovered elements based on gaps in atomic number and mass. He accurately forecast eka-silicon (germanium) and eka-aluminum (gallium), later confirmed by experiments. Modern versions refine his vision with precise atomic mass data.
Every entry on the periodic table of elements with atomic mass number reflects decades of experimental measurement. Values are updated by the International Union of Pure and Applied Chemistry (IUPAC) every four years based on new mass spectrometry data. The latest values, published in 2021, reflect improved precision in isotope abundance measurements.