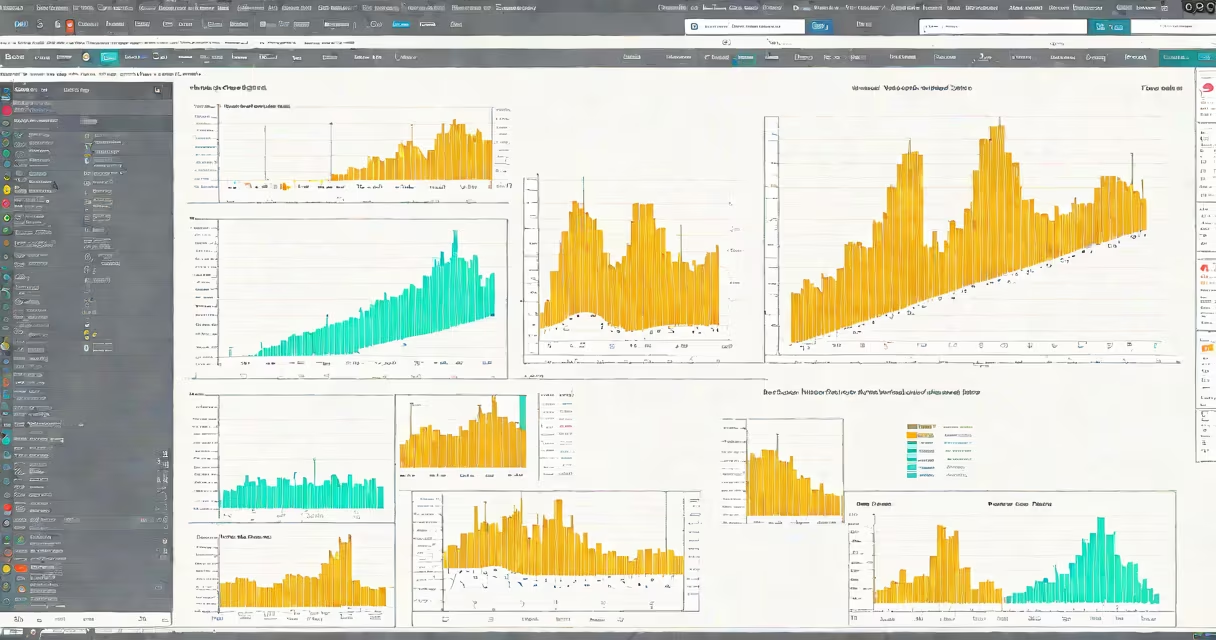
JASP statistical software is a free, open-source program for data analysis and visualization, developed primarily for researchers and students in the social, behavioral, and life sciences. It supports both frequentist and Bayesian statistical methods with intuitive graphical interfaces and transparent reporting.
Designed with reproducibility and accessibility in mind, JASP runs on Windows, macOS, and Linux. Its core purpose is to make advanced statistical techniques available without requiring programming skills. Users can import data from CSV, Excel, SPSS, and other formats, then perform analyses ranging from basic t-tests to multilevel modeling.
Developed by a team led by Eric-Jan Wagenmakers at the University of Amsterdam, JASP is backed by the JASP Foundation and supported by academic institutions globally. It integrates smoothly with R through plug-ins, enabling users to extend functionality while maintaining a user-friendly front end.
JASP operates on a point-and-click interface. After loading a dataset, users select an analysis from a menu-such as ANOVA, correlation, or linear regression-and the results appear instantly in a clean, readable format. All outputs include effect sizes, confidence intervals, and visualizations.
For example, running a t-test requires only selecting the variables, choosing the test type, and checking options like "Bayesian" or "solid." Results display in a table with clear interpretations, including Bayes factors and posterior distributions. This eliminates the need to manually interpret complex output or write code.
Behind the scenes, JASP uses the R programming language for computation. However, users don't need to write R scripts. Instead, JASP generates and logs R code automatically, allowing advanced users to inspect or modify analyses. This dual-layer design supports both beginners and experts.
JASP offers two primary modes: classical (frequentist) and Bayesian. The Bayesian mode allows users to compute Bayes factors, which quantify evidence for or against a hypothesis-something traditional p-values cannot do. For instance, a Bayes factor of 3 indicates moderate evidence in favor of the alternative hypothesis.
The software includes specialized modules for:
A non-obvious feature is JASP's ability to generate changing plots. As users adjust model parameters, graphs update in real time. For example, changing the prior distribution in a Bayesian t-test instantly updates the posterior density plot, helping users understand how assumptions affect outcomes.
JASP is often mistaken for SPSS or Stata due to similar layouts. But unlike those commercial packages, JASP is free and open-source. It does not require a license fee or subscription, making it accessible to students and low-budget labs.
Another misconception is that JASP lacks power because it doesn't support scripting. In reality, it exports R code for every analysis, enabling automation and integration into larger workflows. A researcher can copy the generated code and run it in RStudio for further customization.
Unlike some free tools that sacrifice accuracy for simplicity, JASP's statistical algorithms are peer-reviewed and published in journals such as Behavior Research Methods. The software follows APA standards for reporting, ensuring results meet publication requirements.
| Feature | JASP | SPSS | R (base) |
|---|---|---|---|
| Cost | Free | $600+/year | Free |
| Graphical Interface | Yes, intuitive | Yes, complex | No (requires coding) |
| Beta Distribution Support | Yes (in Bayesian modules) | No | Yes (via libraries) |
| Exportable Code | Yes (R) | No | Yes |
In a 2022 study on student motivation in online learning, researchers used JASP to analyze survey responses from 147 participants. They tested whether perceived autonomy predicted engagement using a Pearson correlation and a Bayesian linear regression.
Data was imported from a CSV file. The team selected "Bayesian Linear Regression" from the menu, set the dependent variable as "engagement score," and the predictor as "autonomy rating." They enabled default priors and requested posterior summaries.
Results showed a Bayes factor of 12.4 in favor of the alternative hypothesis-indicating strong evidence that autonomy predicts engagement. The posterior mean for the slope was 0.42 (95% credible interval: 0.21 to 0.63). Visual output included a scatterplot with the regression line and prediction intervals.
This analysis was completed in under 10 minutes. The final report included the full JASP output, which met journal guidelines without additional formatting.
I used JASP during my graduate work in psychology. When analyzing reaction times, I needed to compare two groups using a solid t-test. The interface guided me through each step. After reviewing the results, I exported the R code to replicate the analysis in a larger dataset. The transparency and ease of use saved hours compared to writing custom scripts.
JASP is trusted by institutions such as Stanford University, the University of Oxford, and the Max Planck Institute. It is recommended in teaching materials for introductory statistics courses due to its clarity and pedagogical value.
According to the Journal of Open Psychology Data, JASP improves statistical literacy by reducing cognitive load during analysis. Users focus on interpreting results rather than debugging syntax.
JASP statistical software delivers professional-grade analysis without cost or complexity. It's not just a tool-it's a platform for transparent, ethical, and reproducible science.