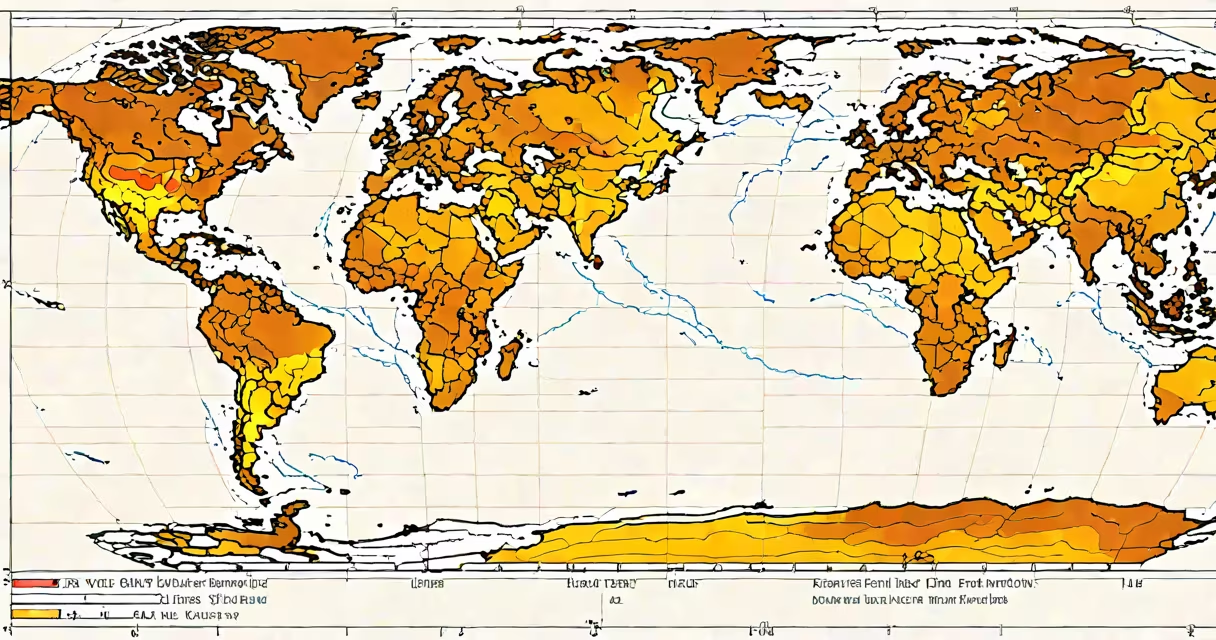
El Niño occurs irregularly, typically every 2 to 7 years, with an average recurrence interval of about 3.5 years. It is part of the El Niño-Southern Oscillation (ENSO) cycle, a natural climate pattern involving changes in sea surface temperatures and atmospheric pressure across the tropical Pacific Ocean.
El Niño develops when the usual east-to-west trade winds weaken or reverse, allowing warm surface waters from the western Pacific to flow eastward. This shifts heat and rainfall patterns globally, disrupting normal weather systems. The phenomenon usually lasts 9 to 12 months and can intensify into a strong event with far-reaching effects.
The timing of El Niño is not predictable on a fixed schedule. Some years have multiple events, while others go several years without one. The most recent major El Niño occurred in 2023-2024, following a weaker event in 2015-2016. These events are driven by complex interactions between ocean currents, wind patterns, and atmospheric feedback loops.
El Niño begins when the trade winds that normally push warm water toward Asia weaken. Without this wind-driven push, warm water accumulates in the central and eastern Pacific. Sea surface temperatures rise above average-typically by 0.5°C or more-over a broad region near the equator.
This warming alters atmospheric circulation. Rising air over the warmer ocean creates low-pressure zones, shifting storm tracks and altering precipitation patterns worldwide. For example, the U.S. Southwest often sees increased winter rainfall during El Niño, while Southeast Asia and Australia may face drought conditions.
El Niño typically peaks between December and February, coinciding with the Northern Hemisphere's winter. It then weakens during spring and summer, eventually transitioning into La Niña, the cooling phase of ENSO. The full cycle can take 2 to 7 years to complete, depending on oceanic and atmospheric feedback strength.
El Niño events are classified by intensity based on sea surface temperature anomalies in the Niño 3.4 region (central tropical Pacific). The categories are:
| Category | Temperature Anomaly | Typical Duration | Historical Examples |
|---|---|---|---|
| Weak | +0.5°C to +1.0°C | 6-12 months | 1986-1987, 2009-2010 |
| Moderate | +1.0°C to +1.4°C | 9-15 months | 1991-1992, 2011-2012 |
| Strong | +1.5°C to +2.4°C | 12-24 months | 1982-1983, 1997-1998 |
| Very Strong | ≥+2.5°C | 18-30 months | 2015-2016 |
Strong and very strong events cause the most significant global disruptions. The 1997-1998 El Niño was one of the strongest on record, leading to widespread coral bleaching, intense hurricanes, and severe flooding in California and Peru.
Not all El Niño events follow the same pattern. Some are confined to the central Pacific (known as "Modoki" El Niño), which affects different regions than traditional Eastern Pacific events. These variants can produce distinct weather outcomes, such as drier conditions in the southern U.S. despite the warming trend.
El Niño is not a yearly occurrence. Despite media coverage during winter months, it does not happen every calendar year. The average interval between events is approximately 3.5 years, but variation is large. Between 1950 and 2020, there were 23 El Niño episodes, ranging from 1.5-year gaps to 7-year gaps.
Another misconception is that El Niño causes global warming. It does not. El Niño is a natural fluctuation within a stable climate system. While it temporarily raises global average temperatures-such as during the 1997-1998 event, which contributed to record-high global temperatures-it does not alter long-term climate trends.
A lesser-known fact: El Niño events are often preceded by a weakening of the Walker Circulation, a large-scale atmospheric loop that moves air from high pressure in the eastern Pacific to low pressure in the west. This weakening signals the onset of El Niño and can be detected weeks to months in advance using satellite and buoy data.
In 2015-2016, a very strong El Niño led to extreme weather across multiple continents. California experienced heavy rainfall and snowfall, ending a multi-year drought. Meanwhile, Indonesia faced severe wildfires due to dry conditions, and parts of East Africa saw prolonged droughts affecting food security.
During the 1982-1983 event, Peru's fishing industry collapsed as cold, nutrient-rich waters disappeared from the coast. Fish populations declined sharply, impacting local economies and triggering a national crisis. This event also caused widespread crop failures in India and Australia.
These examples show that El Niño's influence extends beyond temperature anomalies. It affects agriculture, fisheries, energy demand, and public health. Governments and agencies use ENSO forecasts to prepare for potential impacts. The National Oceanic and Atmospheric Administration (NOAA) issues seasonal outlooks based on ENSO status, helping communities plan for floods, droughts, and heatwaves.
For instance, in 2023, NOAA predicted a moderate El Niño based on rising sea surface temperatures and declining trade winds. The forecast guided emergency planners in California to reinforce flood defenses and allocate resources for wildfire response.
Based on historical data and current modeling, the next El Niño is expected around late 2025 or early 2026. Climate models suggest a gradual increase in sea surface temperatures in the central Pacific, with a 60% probability of El Niño development by the end of 2025.
Forecasting remains uncertain because ENSO is sensitive to small changes in ocean heat content and wind patterns. Even with advanced monitoring tools, accurate predictions are limited to 6-12 months in advance. Scientists rely on data from buoys, satellites, and oceanographic models to track developing conditions.
Understanding how often El Niño occurs requires recognizing both its average recurrence and its variability. While the typical interval is 3.5 years, actual timing varies widely. This unpredictability underscores the importance of continuous monitoring and adaptive planning.