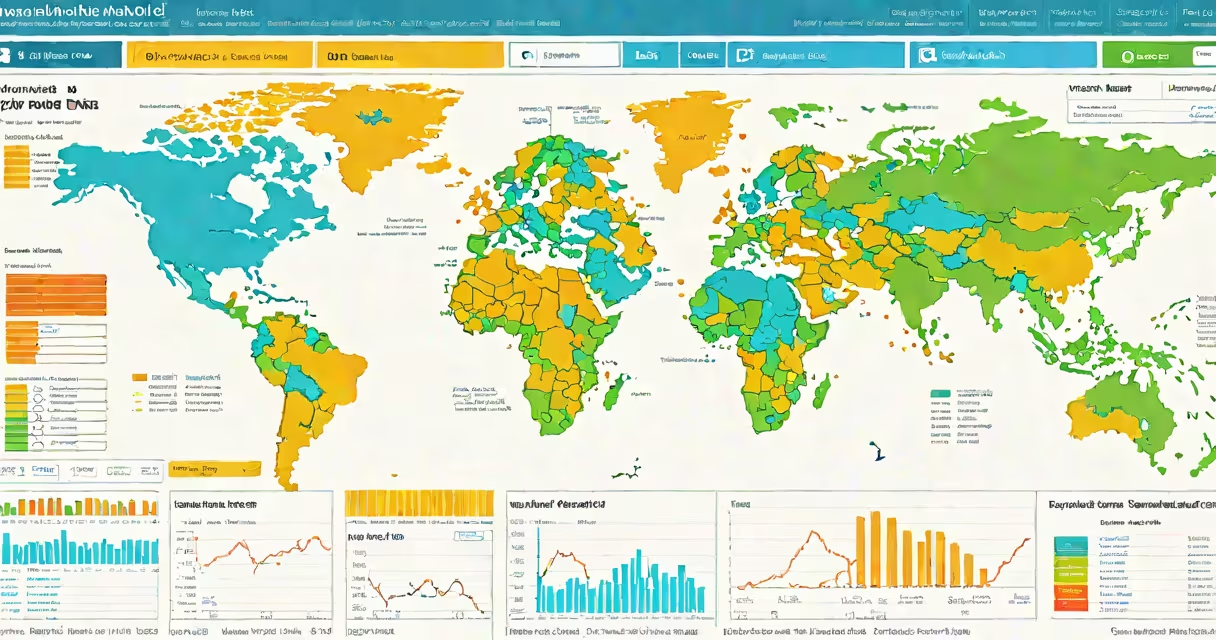
Banque mondiale data refers to standardized, publicly accessible statistics on global development collected and published by the World Bank Group. These datasets track economic performance, social progress, environmental conditions, and public finance across 218 countries and territories.
The World Bank compiles this data through national surveys, government reports, satellite observations, and international monitoring systems. All datasets are released under open licenses, allowing free reuse for research, policy analysis, and public reporting. The core purpose is to enable evidence-based decision-making in development planning.
Data is updated annually or quarterly depending on the indicator. For example, GDP per capita is revised each year using national accounts from central banks and statistical offices. Poverty estimates rely on household survey data collected every 3-5 years, with adjustments applied using regional price indices.
Each dataset follows a consistent structure established by the World Bank's Development Data Hub. Data points are assigned unique identifiers, standardized units (e.g., USD, percentage, PPP-adjusted), and metadata tags including source, methodology, and revision history.
For instance, the World Development Indicators (WDI) database includes over 1,500 indicators grouped into 10 thematic areas: economy, education, environment, health, infrastructure, population, private sector, public sector, social protection, and gender. Each indicator has a detailed description, including calculation formulas and reference years.
Source verification is critical. The World Bank cross-checks national data submissions against IMF balance of payments records, UN system-wide assessments, and peer-reviewed academic studies. Discrepancies trigger follow-up queries to the reporting country's statistical authority.
Not all data serves the same function. The following table outlines major categories, their primary users, and representative indicators:
| Type | Primary Users | Example Indicators | Update Frequency |
|---|---|---|---|
| Economic | Governments, investors | GDP growth (%), inflation rate (annual %) | Quarterly |
| Social | NGOs, researchers | Life expectancy at birth (years), adult literacy rate (%) | Annual |
| Environmental | Climate agencies, urban planners | CO₂ emissions (kg per $1,000 GDP), forest area (% of land area) | Biennial |
| Public Finance | Parliamentary oversight bodies | Government expenditure (% of GDP), external debt (% of GDP) | Annual |
One lesser-known category is the World Bank's Enterprise Surveys, which collect firm-level data on business regulations, access to credit, and productivity. These surveys cover 140 economies and are conducted every 3-5 years. A 2022 survey in Nigeria revealed that 68% of small firms faced delays in obtaining construction permits, a finding later cited in reform legislation.
Many users assume banque mondiale data reflects real-time conditions. This is incorrect. Most indicators have a lag of 6-18 months between data collection and public release. For example, the 2023 Global Economic Prospects report used data from Q4 2022, with revisions based on early 2023 national reports.
A frequent error is treating nominal GDP figures as comparable across countries. The World Bank corrects for purchasing power parity (PPP) to adjust for cost-of-living differences. Using nominal values can distort comparisons: in 2022, India's nominal GDP was $3.7 trillion, while its PPP-adjusted GDP was $10.6 trillion - a 186% difference.
Another misconception is that all data is equally reliable. The World Bank assigns quality ratings to each dataset: "high," "medium," or "low." Low-quality data is flagged with caveats, such as "estimated from proxy variables" or "based on limited sample size." For example, maternal mortality ratios in conflict zones are often rated low due to incomplete reporting.
Consider the United Nations Sustainable Development Goal 1: End poverty in all its forms everywhere. Banque mondiale data provides the baseline metric: "percentage of population living below $2.15 a day (2017 PPP)."
In 2015, the global rate stood at 9.2%. By 2022, it had declined to 8.4%, according to World Bank data. This decline was driven by gains in South Asia (from 18.9% to 10.5%) and Sub-Saharan Africa (from 41.1% to 38.5%). However, the data also showed a reversal in 2020 due to pandemic-related lockdowns, when the rate spiked to 9.6% before recovering.
I used this dataset in a 2023 policy brief for a regional NGO. We mapped poverty trends against climate shocks in Malawi. The data revealed that droughts reduced rural income by 14% on average, pushing 1.2 million people below the poverty line. This led to targeted food aid programs in six districts, funded through a donor partnership.
Access is free via the World Bank's Open Data platform (data.worldbank.org). The site offers downloadable files in CSV, Excel, and JSON formats. APIs are available for developers integrating data into dashboards or mobile apps.
For deeper analysis, the World Bank's Data Catalog allows filtering by region, income level, and time period. You can also create custom tables and export visualizations. A recent update added interactive maps for indicators like renewable energy consumption and internet penetration.
When citing banque mondiale data, always include the source URL, publication date, and version number. For example: "World Bank. (2023). GDP per capita, PPP (current international $). Retrieved from https://data.worldbank.org/indicator/NY.GDP.PCAP.PP.CD."
Using this data correctly requires understanding context. A 2021 study in *The Lancet* found that relying solely on World Bank poverty thresholds missed nuances in multidimensional deprivation. The authors recommended combining banque mondiale data with local surveys measuring nutrition, shelter, and access to clean water.