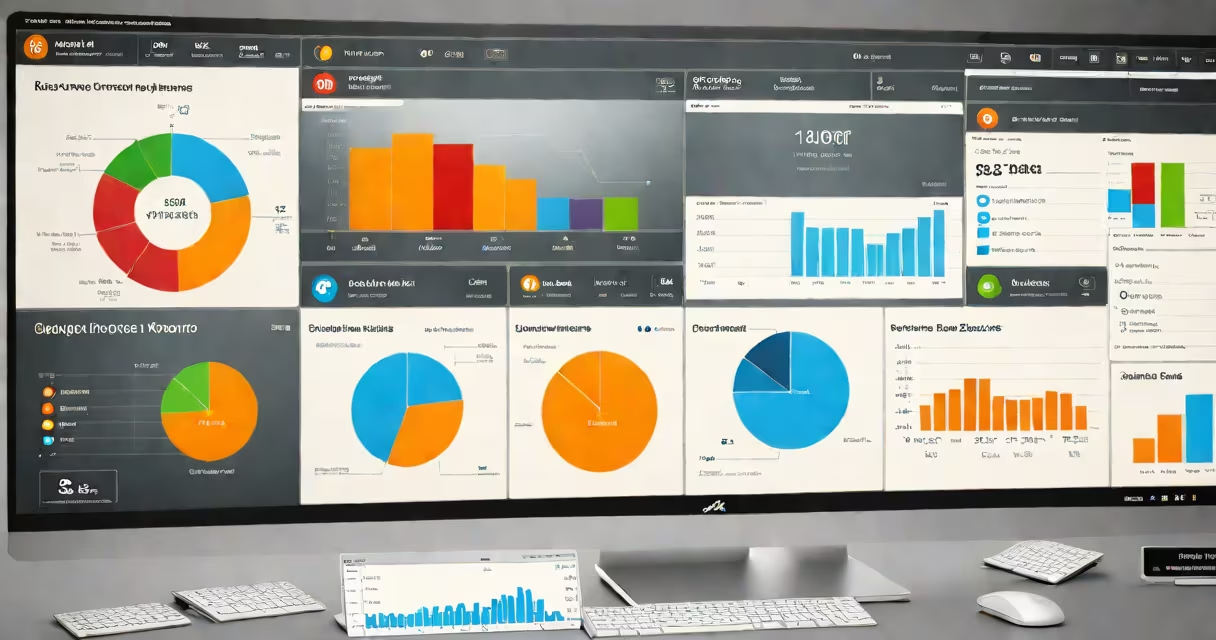
Cognos reports are structured data presentations generated through IBM's Cognos Business Intelligence set, transforming raw transactional data into visual summaries, trend analyses, and performance dashboards used by organizations to track KPIs, monitor operations, and support strategic planning.
These reports pull live or scheduled data from databases, data warehouses, or cloud sources. They display results in tables, charts, maps, and scorecards tailored to specific roles-finance teams see budget variance, supply chain managers track delivery timelines, and executives view revenue forecasts. The system supports drill-downs, filters, and export options for deeper analysis.
IBM Cognos Reporting is widely deployed in finance, healthcare, retail, and manufacturing sectors. For example, a regional hospital network uses Cognos reports to track patient admission rates, bed utilization, and staffing ratios across 12 facilities. Data updates hourly, enabling leadership to adjust staffing during flu season based on real-time demand patterns.
Reports begin with a data model built from underlying databases or data marts. Users define queries using Cognos Query Studio or Report Studio, selecting fields, applying filters, and setting aggregation rules such as SUM, AVG, or COUNT. Once saved, the report runs on a schedule or on-demand via web portal or mobile app.
Each report includes metadata-labels, units, time periods, and ownership details-to ensure clarity. Visual elements like bar charts show monthly sales trends; heat maps show underperforming stores. Interactive features allow users to click on a region to see store-level breakdowns, then filter by product category or sales rep.
Security is enforced at multiple levels. A regional manager sees only their territory's data. A finance auditor accesses full historical records but cannot modify data. Access rights are managed through IBM Cognos Security Manager, which integrates with enterprise identity providers like Active Directory.
Reports fall into four primary categories based on purpose and structure:
| Type | Purpose | Example Use Case | Common Output Format |
|---|---|---|---|
| Ad hoc | Quick, user-driven exploration of data | Marketing analyst compares campaign ROI across regions | Interactive web view, PDF export |
| Standard | Regularly scheduled, consistent format | Monthly financial statement for board review | PDF, Excel, HTML |
| Dashboard | Real-time monitoring of KPIs | Operations center tracking shipping delays by carrier | Web-based interface with live refresh |
| Scorecard | Goal tracking aligned with strategy | HR department measuring diversity hiring targets | Color-coded indicators, trend lines |
Ad hoc reports are created dynamically by users without IT involvement. Standard reports follow predefined templates and are often sent automatically via email. Dashboards update continuously and are designed for operational visibility. Scorecards map performance against objectives, often using traffic-light color coding (green = on track, red = off track).
Enterprises use Cognos reports to align departments around shared data. A global retailer generates weekly Cognos reports on inventory turnover, identifying slow-moving SKUs across 500 stores. These reports trigger automated restocking alerts when stock falls below threshold values set in the data model.
One client, a mid-sized logistics provider, reduced shipment delays by 18% after deploying Cognos dashboards that track on-time delivery rates by driver and route. The system flagged drivers with consistently late deliveries, prompting targeted training and route optimization. This change was validated by internal audit data, which showed a 22% drop in customer complaints related to timing.
A common misunderstanding is that Cognos reports are static documents. In reality, most are changing-data refreshes automatically, and users can interact with visuals. Another error is assuming reports require complex coding. While advanced customization uses XML or JavaScript, standard reports are built with drag-and-drop tools accessible to business analysts.
People often mistake Cognos reports for spreadsheets. While both display data, Cognos pulls from centralized systems and enforces governance. A spreadsheet might contain outdated or inconsistent figures; a Cognos report ensures all users see the same source data, updated in real time.
Another misconception is that Cognos reports are only for technical staff. In practice, many are designed for non-technical users. A regional sales director receives a daily Cognos report showing team performance against quota, with clear icons and color gradients. She doesn't need to understand SQL or database schemas-just interpret the visual cues.
One non-obvious fact: Cognos reports can include predictive analytics. Using IBM Watson Studio integration, a report can forecast next quarter's sales based on historical trends, economic indicators, and seasonal variables. A 2022 study by Gartner found that organizations using predictive reporting in Cognos saw a 14% improvement in forecast accuracy compared to manual methods.
Consider a company selling industrial equipment. The sales team needs a monthly report showing regional performance, deal size, and conversion rate. Here's how it's built:
The final output shows the Northeast region with the highest average deal size ($87,000) and the Southeast with the fastest close rate (68%). This insight led to a reallocation of sales resources, boosting quarterly revenue by 9%.
When designing reports, avoid overloading visuals. A single report should focus on one decision-making goal. Too many charts create cognitive load and reduce actionability.
Cognos reports are not just data displays-they are decision engines. They turn isolated numbers into narratives that guide strategy, improve efficiency, and reduce risk. For those managing data workflows, understanding how these reports function is essential.